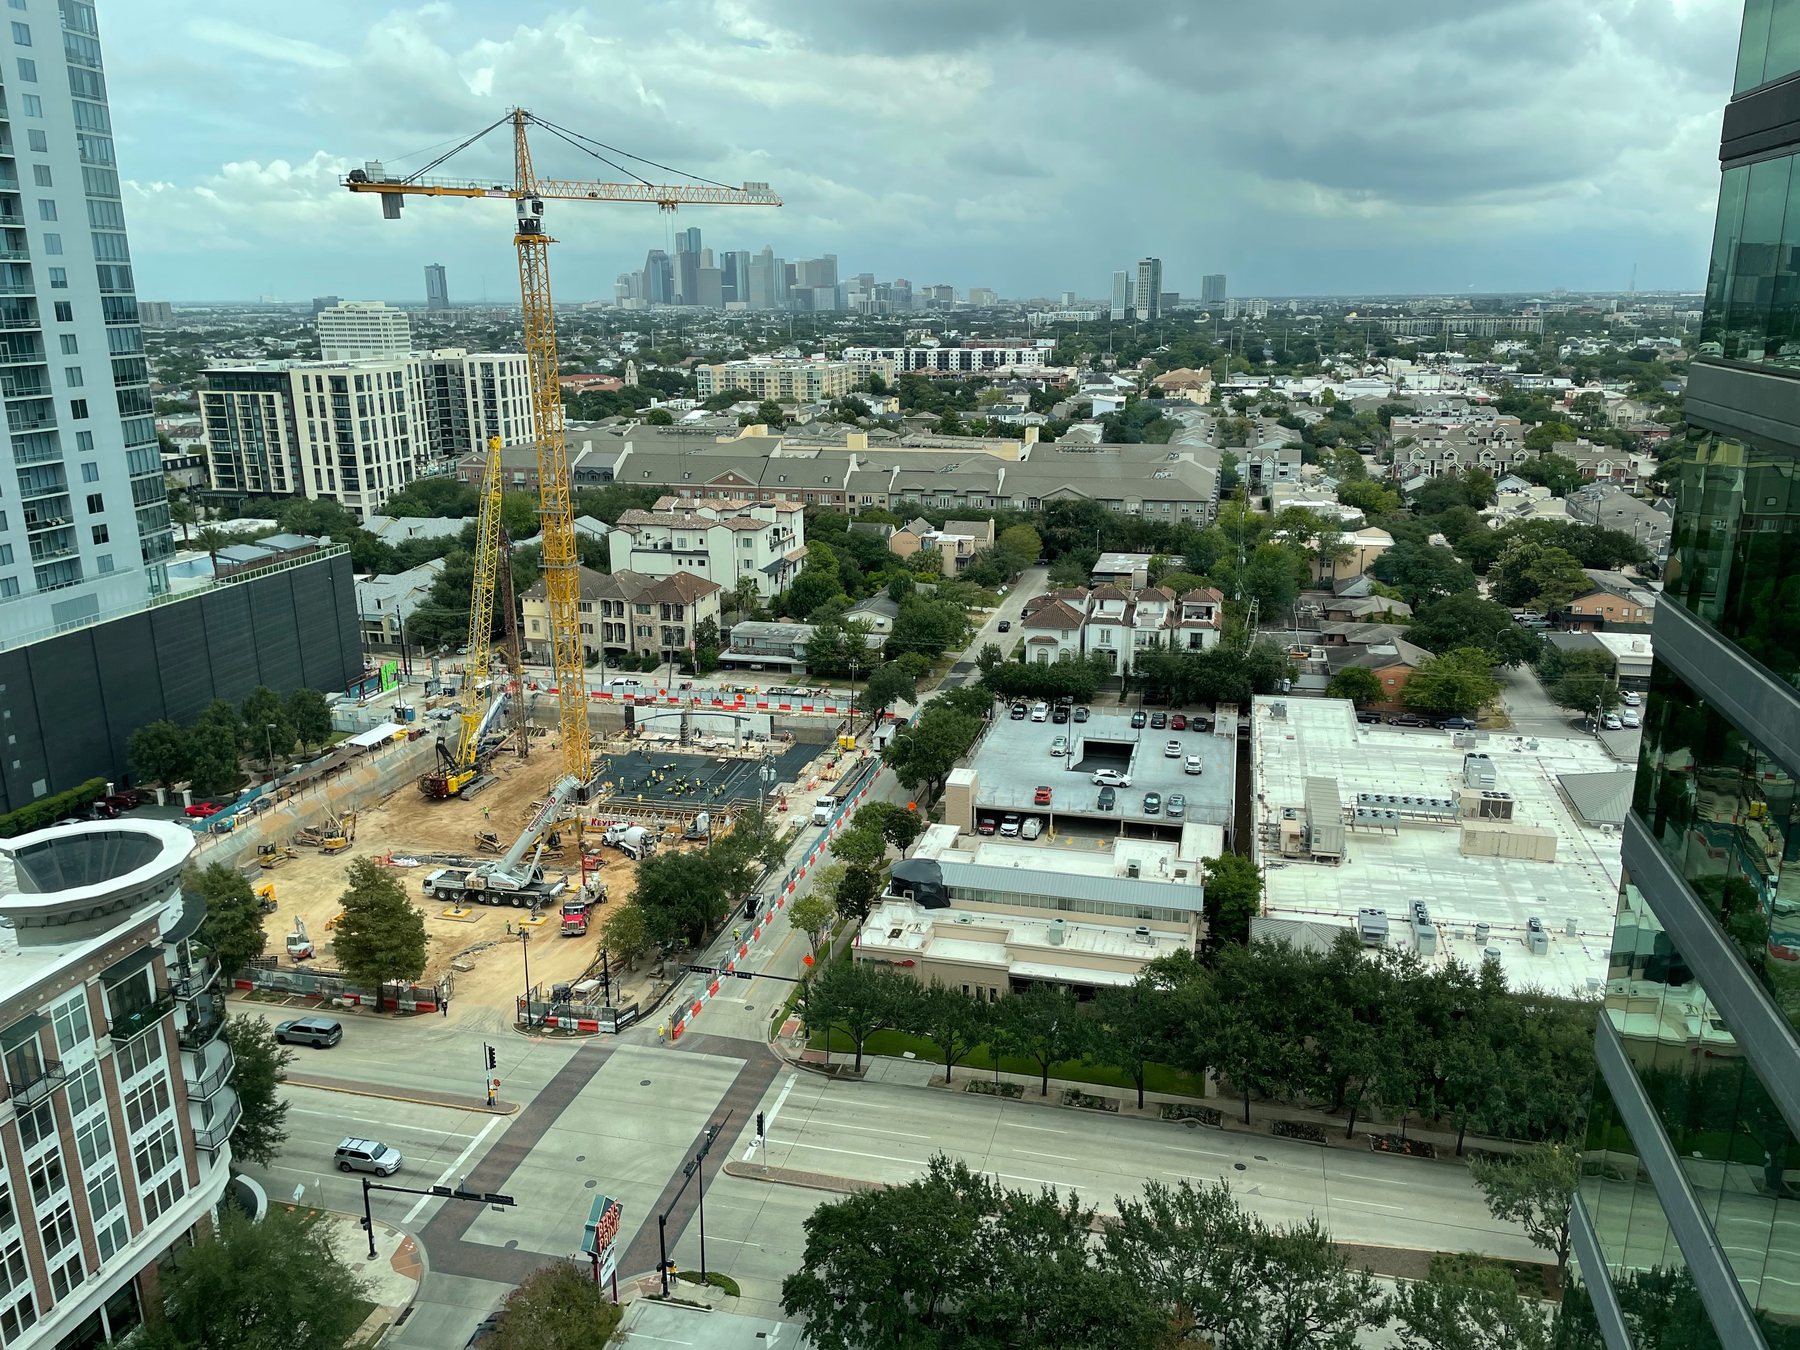
A photograph of Houston, looking east toward downtown on a grey September afternoon. A crane in the foreground, a construction site, a parking deck, a dense middle distance of townhomes, and about four and a half kilometres away a cluster of towers in the haze. A simple question: what are all of these?
The interesting part is not the answer. It is that the first two answers were wrong, and that the method which caught them is the same one that produced them.
Pass one: reading shapes
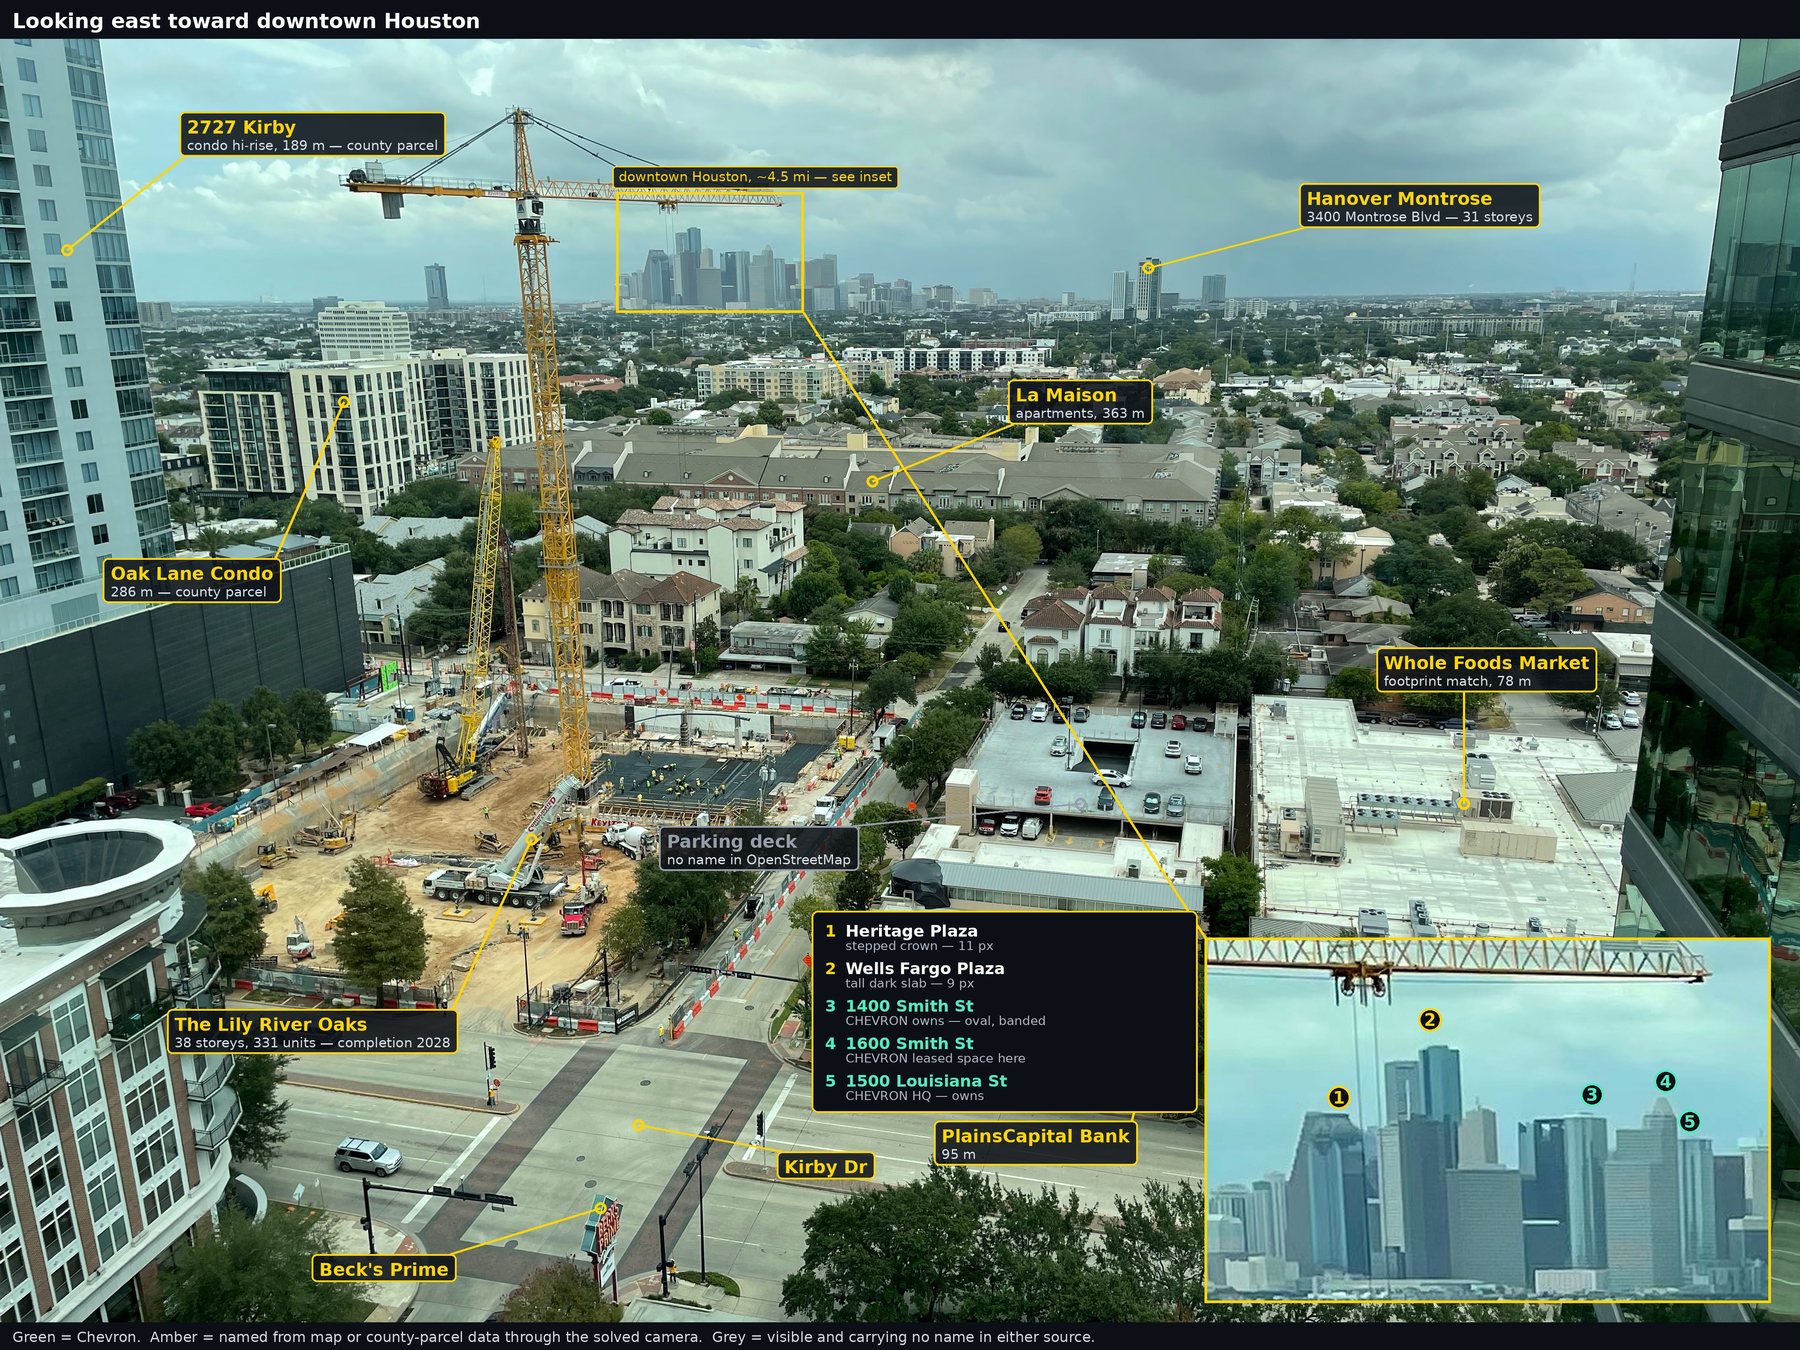
The first pass is what anyone does — look at the silhouettes and match them against buildings you can name. Some of them are genuinely distinctive. A stepped, terraced crown. A tall dark slab. A pair of trapezoids with a slot of sky between them.
That pass produced five names, four of them stated with more confidence than they deserved. It also produced something better: an admission that a cluster to the right could not be identified at all, and a refusal to guess at it. That refusal turned out to be the most accurate thing in the first pass.
Pass two: someone who knows the neighbourhood
Two corrections arrived from a person who could see the same view. The unidentifiable cluster was a neighbourhood I had placed too far south. The construction site had a name, a developer, a storey count and a completion date — all of which checked out against the developer’s own filings once I knew what to look for.
This is worth dwelling on. Local knowledge beat both the silhouette reading and, later, the map data, because the map had not caught up with a building that broke ground five months earlier. It also gave me something the photograph could not: the developer’s description independently fixed which intersection I was looking at, which every later pass depended on.
Pass three: solving the camera
Eyeballing has a ceiling. The way past it is to stop looking at the picture and start solving it.
A photograph is a projection. If you know where the camera was, which way it pointed, how far down it tilted and how wide its field was, every point on the ground has exactly one place it can appear in the frame — and the arithmetic runs backwards too. So the problem becomes: recover those five numbers.
The EXIF gave a focal length and nothing else — no GPS, no heading. But the frame itself is full of constraints. A tall narrow tower’s horizontal position depends only on its bearing, so each one I could name confidently was an equation. The horizon line, found by scanning columns for where sky stops being sky, fixes the tilt. A street intersection visible in the frame fixes two more.
Five parameters, nine observations spanning seventy metres to five and a half kilometres, fitted by Nelder–Mead. Final residual: 0.9 pixels.
Two things fell out of that fit that no amount of looking would have produced. The first is that my assumed camera position was thirty-seven metres off — irrelevant at five kilometres, decisive at one hundred. The near field simply would not line up until the building’s own mapped footprint replaced a street-address geocode. The second is that the fit itself is a test: a camera model that lands four independent towers within three pixels of where you read them is telling you the readings were right.
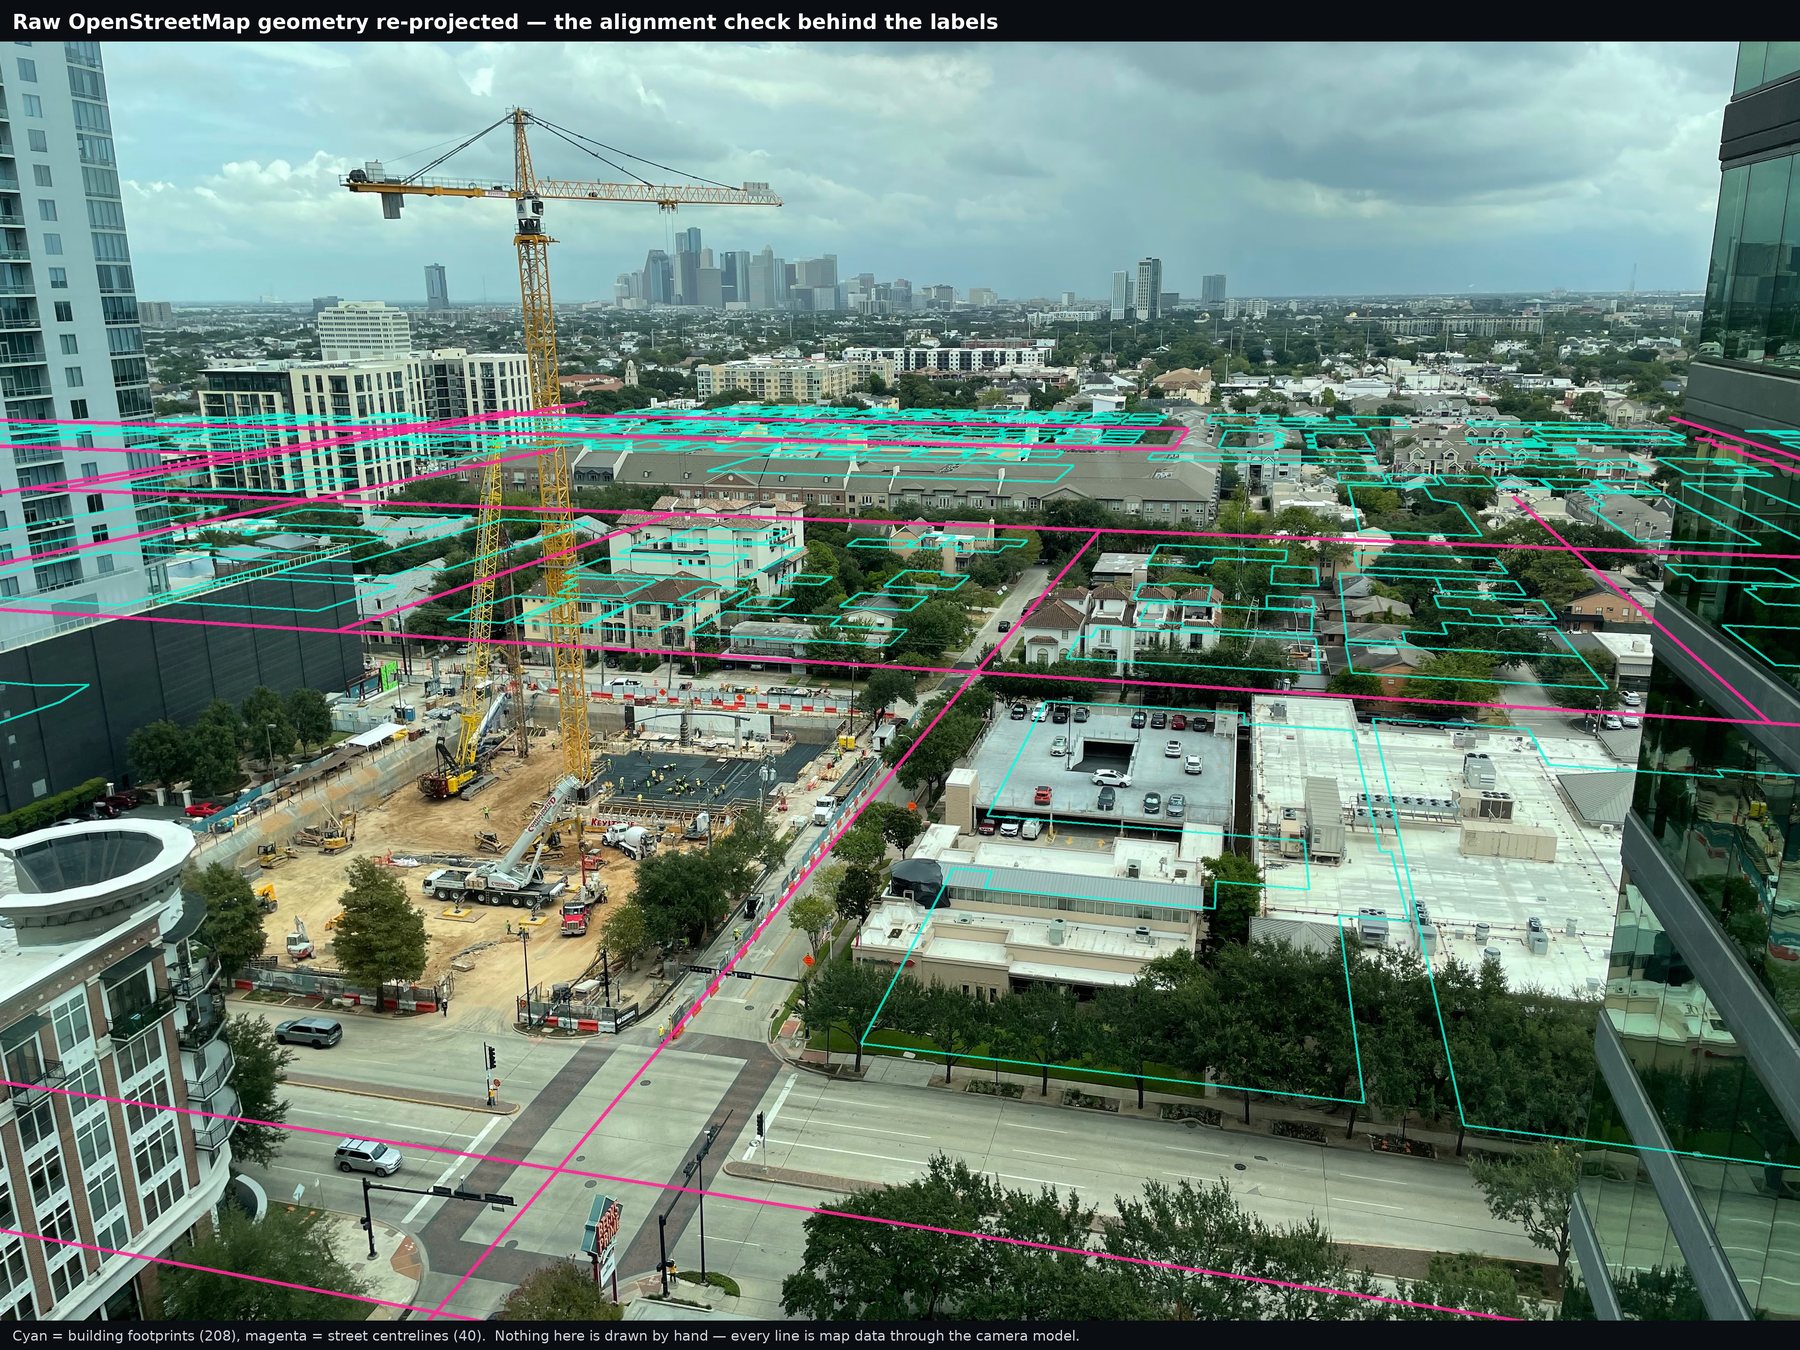
I keep this image because it is the one that can falsify the others. A labelled picture asks to be believed; a wireframe shows you the residual and lets you decide.
Pass four: projecting the map
With a camera model, naming things stops being interpretation. OpenStreetMap features go through the same projection and land where they land.
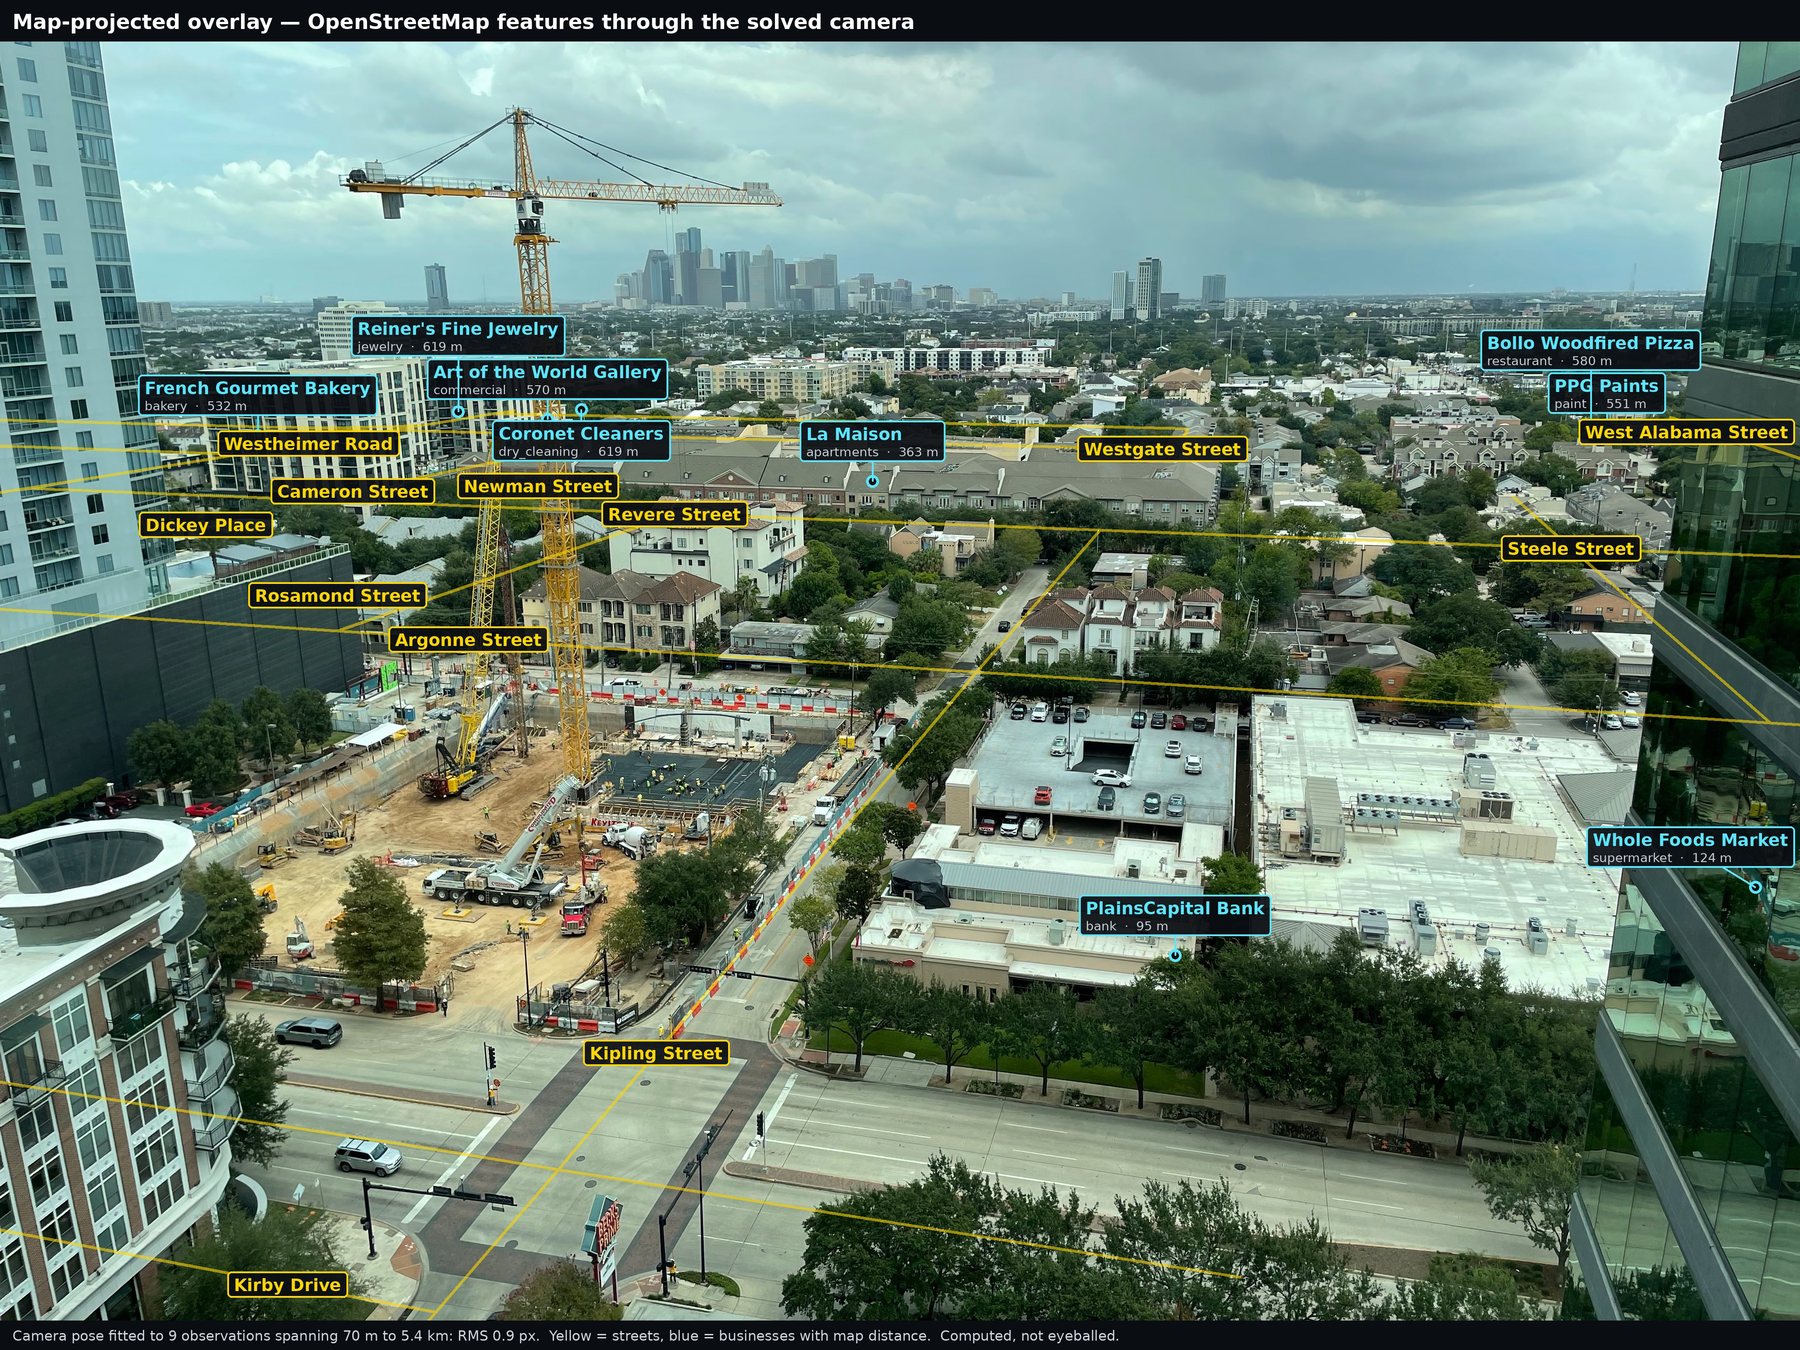
This pass also found the limit of the method, which is not the method. One block in the frame has no named footprint in the map at all, so the parking deck stays unnamed. That is a gap in the data, and it matters to know which of the two you are looking at when something comes back blank.
Pass five: heights, and the two wrong answers
Everything so far projects ground positions. Towers are not on the ground. To place a tower’s top you need its height, and that is where two more sources come in: Wikidata, which carries coordinates and published heights for named buildings, and USGS 3DEP LiDAR, which carries the actual returns off the actual roofs.
The LiDAR is a point cloud in an octree on public storage. You descend the hierarchy toward your target, pull the node, and take the highest dense band of returns over the footprint. The first attempt reported one tower at 480 metres against a published 302. That was birds — a 99.9th percentile on a sparse sample picks up whatever is flying. Replacing it with “the highest two-metre band holding at least eight returns” brought a 50-storey tower in at 213.9 metres against a published 210.6, and another at 223.3 against a published 223.
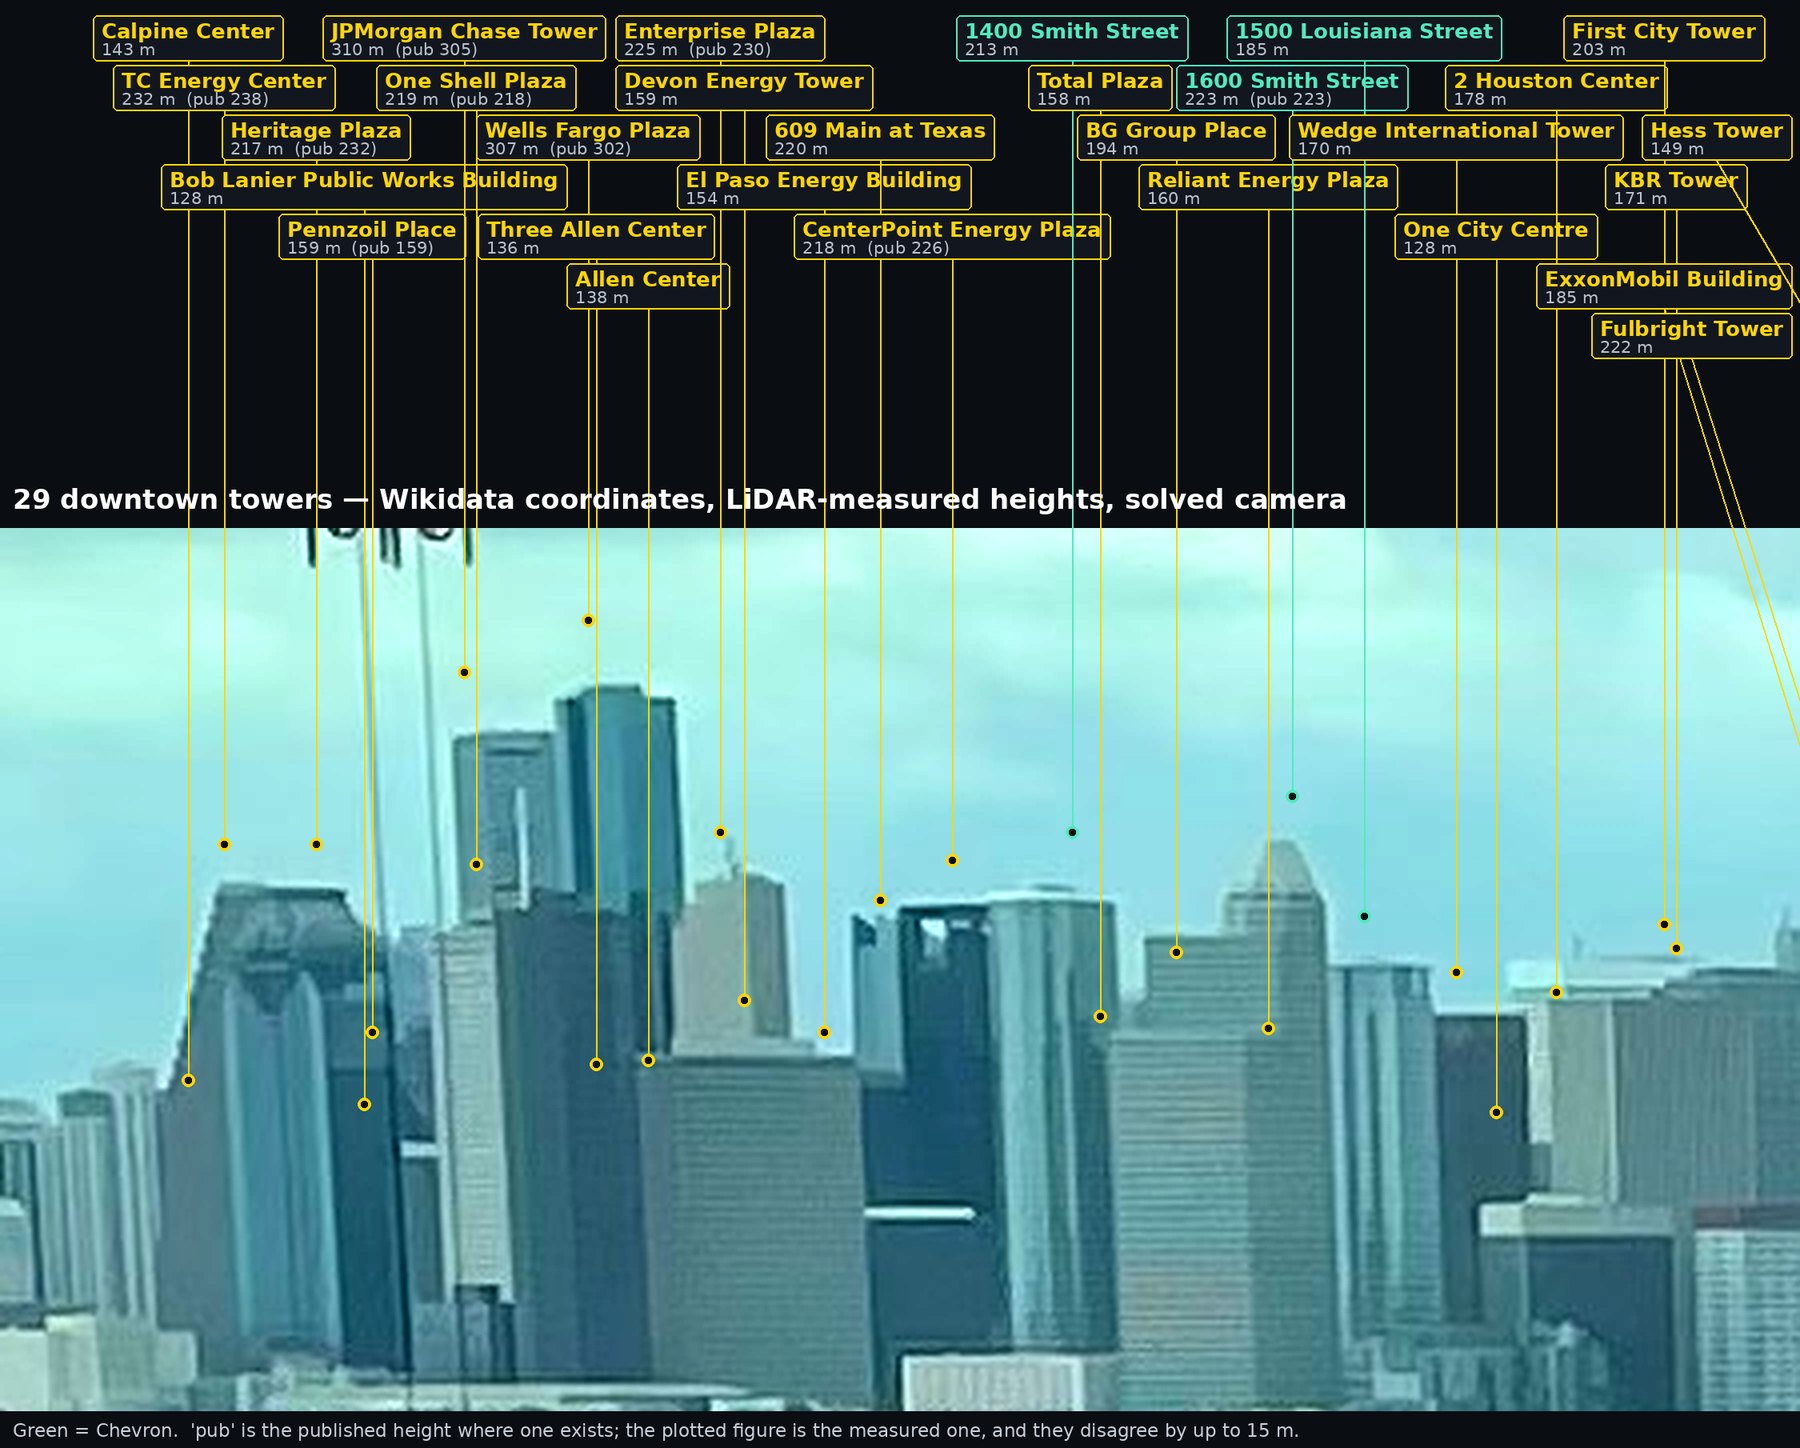
Now the corrections. Two of my confident first-pass names were wrong, and the projection says so arithmetically. One tower I had named sits, by coordinate, 150 pixels from where I put the label — the silhouette I was reading belonged to a different building entirely. A second name was wrong the same way.
The replacement is better founded, and it is worth saying why rather than just asserting it. One tower downtown is oval in plan and wrapped in horizontal bands — a silhouette nothing else of that size shares. It projects to within four pixels of where I read it. Beside it stand two more, and at first I could not tell which was which: they sit eighteen pixels apart horizontally, against a reading precision of about twenty-five.
Once the camera is solved, naming one tower costs the same as naming thirty. The figure above carries twenty-nine, and the check that they are right is not that they look plausible — it is that where an independent published height exists, the height measured off the roof agrees with it: Pennzoil Place to a tenth of a metre, 1600 Smith to half a metre, One Shell Plaza to one.
LiDAR broke the tie, but not the way I expected. It did not improve the horizontal separation at all — that comes from coordinates and was always fine. It gave the two towers different heights, which moved their predicted roof-lines thirty pixels apart vertically. Then measuring the photographed silhouette column by column found both of them, each about ten pixels below its prediction, with the same residual on a third tower as a control. Three independent towers, one consistent bias, both members of the pair located.
What I would keep
Four things, none of them about skylines.
A confident reading and a correct reading feel identical from the inside. Every wrong name in pass one felt exactly as solid as the right ones. What separated them was not more looking.
The check is worth more than the answer. The wireframe is the least impressive image here and the only one that can prove the others wrong.
Know whether a blank is absence or ignorance. The unnamed parking deck and the unidentified cluster look the same in the output and are completely different problems — one is a hole in the data, the other was a hole in me.
The person standing there still wins sometimes. The best single correction in this whole exercise came from someone who simply recognised the view, about a building too new to be in any of the datasets.
Caveats. Terrain is treated as locally flat, which measurement showed costs about a pixel at this range. Camera roll is assumed zero. Heights for buildings Wikidata lists only by storey count are estimated at 3.9 metres per floor and should not be trusted. The LiDAR survey predates at least one building in frame. Two measured heights disagree with their published figures by more than ten metres and I have not established which is wrong. Corrections welcome — this post will be updated rather than reissued if any of it turns out to be mistaken.